
You’re tracking AI visibility. It goes up from 31% to 34%.
A very reasonable question to ask is, “does this matter?”
A very reasonable answer is, “maybe.”
We’ve been feeding a fed horse over here when we say that the prompts you track dictate the downstream data you collect, which informs the eventual strategy and tactics. Track the wrong prompts, and you’re answering the wrong question, which leads to the wrong strategy and tactics.
Let’s say that the three point increase came largely from categorical prompts, such as “what is [software]?” and, through segmented analysis, you realize that ChatGPT specifically started mentioning more brands more often in these types of queries. Your competitors also started getting mentioned more often in AI answers.
That sort of erases the value of that three point increase, at least from the standpoint of decision utility (i.e. what are you going to do differently with this information).
There’s also the question of signal versus noise. For example, if you lose 50 hairs a day, it’s unnoticeable and clinically meaningless. If you lose 500 hairs per day, Minoxidil may be worth a look.
With AI visibility, it’s not obvious what constitutes a meaningful change, though it has been studied. In my experience, it varies by industry, model, and your sample size of prompts per topic.
Questions like this are not new to AI search. They’re simply much more salient now as executives scramble to understand performance in AI search.
Heterogeneous data sampling also obscured performance in SEO.
For example, when looking at aggregate organic traffic patterns, one could celebrate wins garnered by very broad and high traffic keywords while losing position and traffic on product-led and high intent terms – the “traffic trap.” This is good for traffic charts, but bad for business.
“All data in aggregate is crap,” as Avinash Kaushik once said.
We’re not talking about a data quality issue, per se. Your prompt tracking tool is likely measuring what you’d hoped it would measure. The problem is more conceptual and requires a bit of a paradigm shift: we are treating AI visibility as a performance metric when it is, functionally, a diagnostic instrument.
The difference between those two things is the difference between managing a patient by their “average lab score” and actually reading the blood work.
Why AI Visibility Is Not a Performance Metric
First thing’s first, we need to get a little bit pedantic.
What is a “performance metric,” really?
According to an AI Overview, which seems to have been quoting Netsuite, it is this:
“Quantifiable data and calculations used to track and assess the success, efficiency, and overall health of a business, project, or employee. They act as a control panel, helping leaders identify operational issues, measure progress toward goals, and make informed decisions.”
The colloquial way I think about it is, “is this a proximate metric (i.e. something we can actually track with low latency) that predictably leads to a desirable business outcome?”
Calling in direct response marketing and performance marketing ads, conversion rate, CAC, CPA, and ROAS are all feasible performance metrics.
With AI visibility, there are a few problems with viewing it as a performance metric.
Problem One: Heterogenous Data & Averages
The first problem is heterogeneity. Not all prompts are equal, and aggregating them destroys the information that makes each set useful.
Branded prompts (“Salesforce reviews”) should approach 100% brand visibility. If they don’t, something is wrong with your brand’s digital footprint. The question you are asking with this set of prompts is not usually “are we visible,” but “are we spoken about accurately and favorably?”
This is diagnostic, but visibility here alone is not a performance target.
Category-education prompts (“what is a CRM?”) naturally carry low brand visibility, though share of voice metrics can provide a lot of clarity on how associated you are with the category in relation to your competitors.
Often, the model is explaining a concept, not recommending a vendor.
But showing up here (or more precisely, having your framework, your terminology, your data cited in the explanation) is valuable from an influence perspective.
It shapes how the buyer thinks about the problem before they ever search for a solution. The visibility number here might be 5%, and that 5% might be a nearly invisible assist that sets up your brand-aware or solution-aware conversations with higher intent and a better level of education around the problem itself.
Product-comparison prompts (“best AI search platform for small teams”) are the competitive battleground. This is where you’re fighting for the recommendation, and where the number most closely approximates a performance signal. But even here, different product lines, different ICPs, different stages of category maturity all produce different baselines. A new product launched three months ago should have lower visibility than your flagship. And we still have a demand calibration issue, which we’ll cover in a minute.
Averaging across these categories is like averaging your blood pressure with your cholesterol with your vitamin D level. The composite tells you nothing actionable. It can often tell you something actively misleading (and potentially obfuscate real issues by overweighting less important prompts or categories).
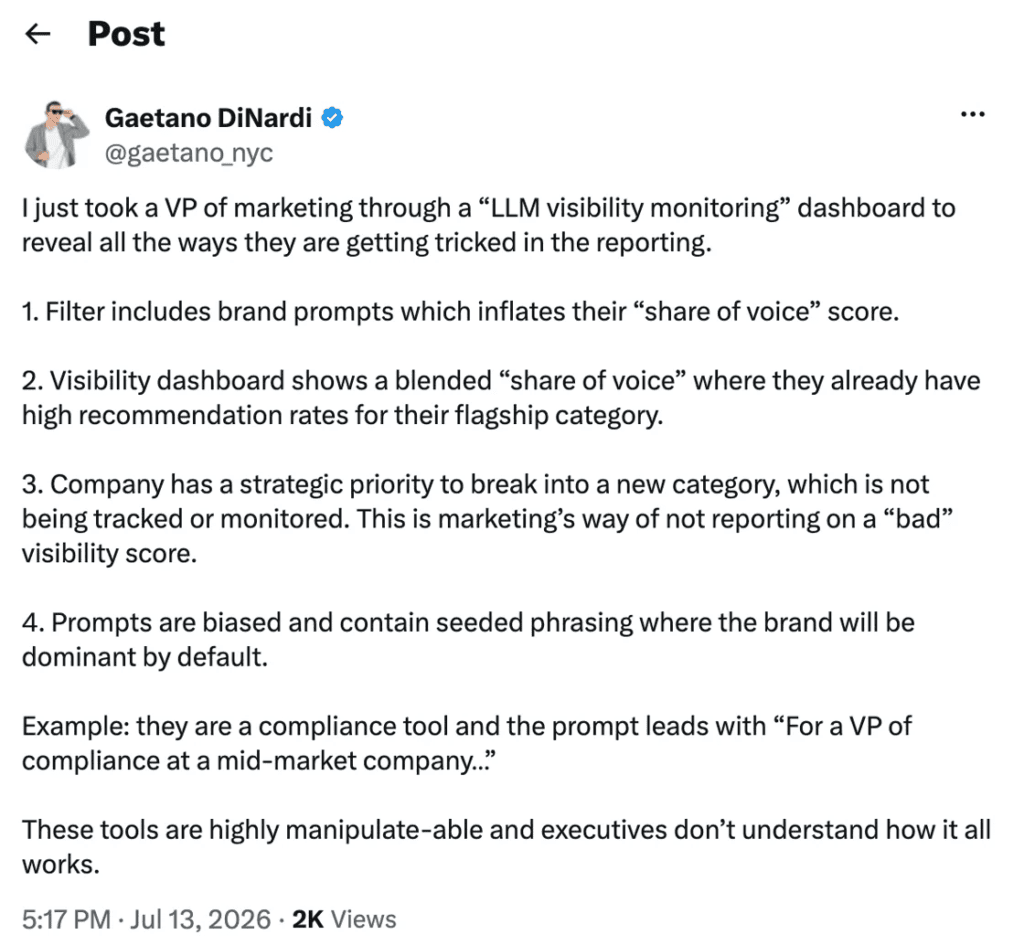
My friend Gaetano put it well in a recent X post:
Problem Two: Demand Calibration
The second problem is the missing denominator.
In traditional SEO, you can see (imperfectly but directionally) how many people search for a given term each month. You can estimate reach. You can calculate share of voice against a known total. You can approximate the TAM of a keyword cluster. In AI search, you cannot.
You’re tracking visibility across a prompt set you chose, measured at intervals you set, with no way to weight those prompts by actual demand. You might be 80% visible on prompts nobody asks and 5% visible on the prompt that drives all the pipeline. You have no way to know from the visibility data alone.
Adding to the complexity, you could have relatively high visibility in a service or product line that does indeed have demand, but the value to your business is much lower.
This is something we deal with as we run holistic organic growth programs, but brands will often come in with a specific request (e.g. technical SEO, AI search strategy, content production, or digital PR).
Let’s say for sake of argument that we’re very high visibility in “content production,” which has a lot of demand (as in, volume of people searching for it), but the leads that come through this topic line are relatively low intent and have the smallest budgets. It would be strategically unwise to celebrate such high visibility at the expense of a more lucrative topic line like technical SEO.
This is why customer and market research is so important and is the fundamental underpinning for our organic growth programs (not just keywords or prompts).
I wrote about this in more detail in a previous piece on prompt volume, exploring the ways prompts decompose and the implications for measurement. The short version: without a demand signal, visibility is an index without a denominator. It tells you your relative position. It does not tell you the size of the opportunity you’re positioned against.
That requires triangulation with other data (namely self-reported attribution, branded search lift, market research, sales call analysis).
Problem Three: Mentions Don’t Mean Recommendations
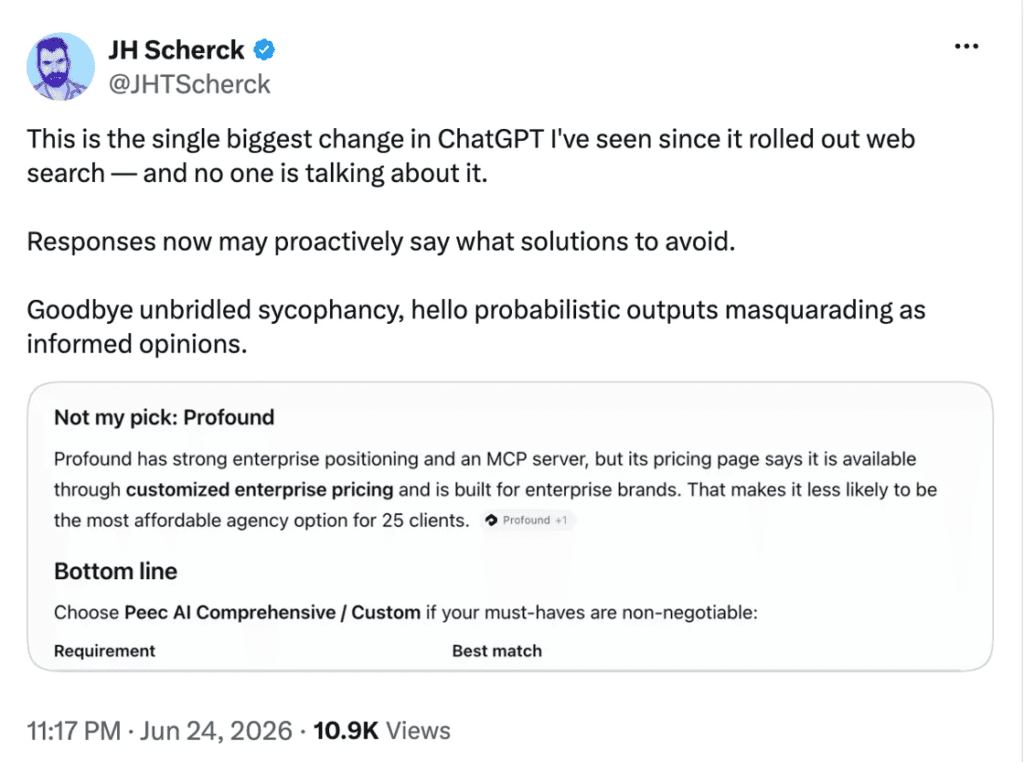
The third problem is the most insidious, and it’s getting more common: mention does not equal recommendation. The tracking tools count binary appearances. You were mentioned in the output, or you weren’t. But LLMs increasingly produce contextual, nuanced responses that the binary doesn’t capture.
The inimitable JH Scherck wrote about this on X, and we see it across our portfolio, too:
Ask ChatGPT for the best CRM for a five-person startup. Salesforce appears in the answer. Visibility score for that prompt: 1.
But the model contextualizes it saying something like: “Salesforce is the industry leader, but it’s overkill for a team your size — the implementation cost and complexity will slow you down.”
That mention is not a recommendation, and while it may positively impact brand awareness, it may also dissuade a potential customer from shortlisting your product.
This, too, is another reason to root your organic growth programs in product marketing fundamentals, clearly articulating who you are, who you are for, what you do, and proof points to back it up.
Bloodwork Versus Interventions
When you go to the doctor and they order blood work, you don’t typically get back a single number.
You don’t get a “health score” (with the exception of modern brands selling to optimizers who obsess over scores like “biological age” without realizing the best way to approximate youth is clearly if you a) can still land a kickflip b) listen to new music or c) can have two glasses of wine on a Wednesday night without feeling like death on Thursday.)
No, you get a panel – a metabolic panel, a lipid panel, a CBC – each containing individual markers, each with its own reference range, each meaningful in different clinical contexts.
Your LDL cholesterol is 122 mg/dL. Is that bad? It depends. What’s your HDL? What was your LDL last year? Do you have a family history of cardiovascular disease? Are you 28 or 58? The number in context is a data point, a diagnostic signal that points you toward specific interventions (more zone 2 cardio, more fiber, possibly a statin).
AI visibility, used correctly, works the same way.
It’s a panel of individual markers (each prompt cluster is a marker) with reference ranges determined by your category, your competitive set, and your own baseline over time.
The value isn’t in the aggregate score, outside of executive level communication and top level diagnosis.
A better way to think about it:
- Group markers, not blended averages. Segment by prompt intent, product/service line, ICP, or topic cluster: branded, categorical, competitive, emerging category. Each segment has its own reference range and strategic significance.
- Trends over snapshots. A single blood draw is noisy (maybe you accidentally had a big meal before the blood draw – who hasn’t been there?). So is a single visibility check. SISTRIX’s research found that AI citation sources rotate 56–74% per week depending on the platform (ChatGPT at the volatile end, AI Mode somewhat more stable). A point-in-time visibility score is sampling from a distribution that shifts weekly. The trajectory across months tells you whether your program is moving the needle.
- Context calibration. Your previous result is your baseline. Your competitive set is your reference population. A new product line launching should show increasing visibility from a low base, and the diagnostic should present abundant gaps and opportunities. A mature product showing declining visibility on core prompts is an alert worth investigating. Calibrate your prompt visibility priorities with your business priorities (product, sales, etc.) instead of aiming for an aggregate rise, which can incentivize growth in the wrong direction which does nothing for the business.
- Citation sources as underlying pathology. The visibility number is the “symptom,” really an outcome of a probabilistic system (or systems if you’re looking at multiple models). The citation sources are the mechanism (or one of the visible mechanisms). Visibility is a scoreboard of sorts, but it reflects many dimensions and actions that happen only on the field itself. An analyst can then diagnose the causes and corrective pathways, which could be very simple (we need to create content around this topic), frustrating (we have more competitors entering the organic conversation), or complex (we have an upstream brand awareness and affinity problem and no amount of listicle outreach will help over the long run).
Some markers matter more than others. This can’t be judged in isolation merely with visibility as a performance indicator. It needs to be rooted in product marketing foundations and calibrated with downstream pipeline and revenue outcomes.
Skrrt: In Defense of Visibility
At this point, you may be reading this as a takedown of AI visibility as a metric. It is not.
When rooted in product marketing foundations and calibrated with meaningful business outcomes, AI visibility is incredibly useful, actionable, and honestly quite impressive in its ability to uncover underlying organic issues related to your brand.
The flip side of confirmation bias here is the naysayer who simply wants to denigrate anything new, related to AI search, or that threatens their own entrenched paradigm. It is Maslow’s hammer, but instead of merely looking for nails, this person overlooks all screws, because certainly nothing could be a screw as you can simply use your hammer, however clumsily, to do drive that screw-shaped nail into the board.
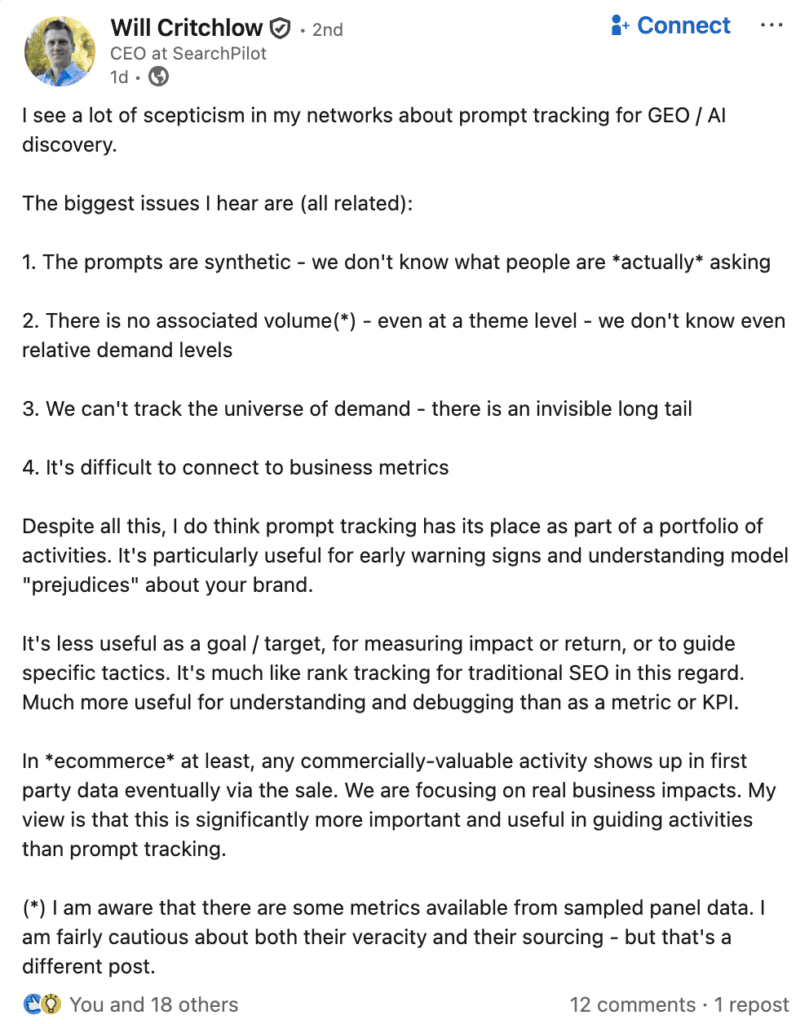
Will Critchlow summarized the skepticism (and responses) well:
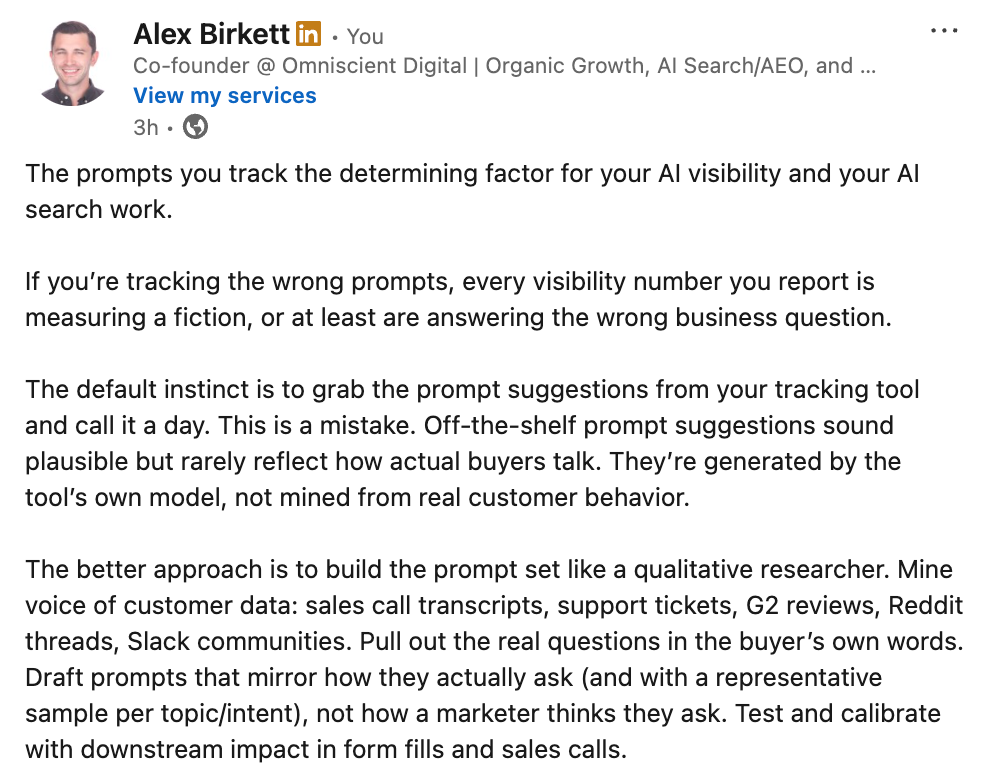
We’ve talked quite a bit about the lack of “volume” associated with prompts, and this may be a contrarian opinion, but I think that’s probably a good thing. It means, in place of third party metrics, we are forced back into a customer and market-centric view of the world.
Others will point to the inherent randomness or personalization with AI engines, but this is a known problem. Personalization is a real issue, I won’t deny that. But probabalistic outputs can be resolved. Twelve people ask an AI engine for best book recommendations and they get 12 different response sets.
But what happens when you ask 12 different people for their best book recommendations?
Sampling and law of large numbers reduce variance and bring stability to the recommendation sets, especially across time. Nearly all AI visibility tools work this way.
On the business outcomes side, yes, it is incredibly hard to connect the value of any given visibility increase with downstream leads or pipeline – at least through click-based telemetry, which was the agreed upon model for the past few decades (despite its own inadequacies and undercounting of SEO’s value). However, there are studies showing the downstream impact of brand visibility in AI on website traffic and conversions (see: Profound and SimilarWeb).
Importantly, prompt tracking gives you a good approximation of your share of voice within a given topic or category, and allows you to understand the underlying citation sources across time that influence it via RAG – not to mention the query fanout aggregation that helps inform content strategy. This arms strategists with a broader array of tools, tactics, and data points than content and links, which leads to one of the fundamental differences in approach, namely that AI search necessitates cross-functional dynamics and “post-channel” thinking.
This is exactly what I worked on when building out the Surround Sound SEO program at HubSpot, albeit with much less data and much less executive interest. But I learned how to string together tools, resources, and teams to monopolize SERPs through affiliate, customer marketing, paid acquisition, SEO, and content.
So we rest in a place of nuance, where AI visibility isn’t the north star performance metric, but it’s also not meaningless. Where, then, does it fit in the marketers constellation of metrics?
Metric Constellations for AI Search
First off, both the map and the terrain in AI search is changing constantly.
We may get better measures, and measures may change in meaning over the course of the coming months and years.
But at this point, our framework relies on a set of metrics that we think of as flashlights that illuminate specific corners of a room, and when we have enough flashlights, we can see the contours of the room, enough that we can maneuver within it.
At the distal end of the scale, we have incremental pipeline and revenue. The most reliable indicator here is self-reported attribution. There are other methods by which we can model incrementality, but these are not possible with all clients and all situations (nor is it warranted in all cases), so the most useful indicator here for the largest number of brands is simply asking prospects where they heard about you.
At the proximate end of the scale, we have channel based metrics, leading indicators, and AI visibility metrics that need to be parameterized to be useful. A citation, for example, is meaningless in isolation; citation share against categorical prompts that are validated as a critical leg of the customer journey, however, is predictive of downstream outcomes.
And then we have input metrics that predict success with leading indicators (and if leading indicators are correctly calibrated, should feasibly lead to tangible and attributable revenue outcomes).
In practice, it looks something like this:
1. Lagging Indicators
- Actual pipeline: leads, users, revenue, from AI sources
- Self-reported attribution: “How did you find us?”
- Blended CRM and analytics data to form a richer picture of how AI plays into discovery and the customer journey today
- Sentiment and messaging alignment in AI answers
2. Leading Indicators
- Referral traffic from AI tools (set this up in GA4 or similar)
- Visibility within AI tools (via Peec, Profound, Scrunch, Otterly, etc.)
- Organic traffic
- Branded traffic
3. Input Layer Visibility
- Brand mentions
- Surround Sound SEO strategy to flood key SERPs and AI answer layers
- Citation share
- Bot crawls
- Page and passage retrieval rates
- Topic / question coverage
The demand-side triangulation is important here, especially as a feedback loop to inform which prompts you track and iterate on the measurement layer. Pair the visibility diagnostic with self-reported attribution (“How did you hear about us?” on your demo form and ideally deeper exploration in sales calls), branded search trends, bot crawls, and direct/AI-referral sessions in GA4.
AI visibility, and its underlying indicators like citation makeup, are often a first step in a diagnostic that then uncovers issues related to brand awareness, category positioning, content coverage, topical authority, and off page authority.
None of these are perfect in isolation, but together, they converge on a picture of how much your visibility actually matters in the market.
And then the diagnostic metric becomes very meaningful.
Want more insights like this? Subscribe to Field Notes


