Any prioritization model built upon keyword difficulty is flawed and leads to suboptimal outcomes.
There, I said it.
Models, including how we prioritize ideas, have inputs and they have outputs. If you have bad inputs, you have bad outputs. And keyword difficulty is a pretty bad input.
Feeding a Fed Horse: Why KD is (Almost) Useless
Gaetano mentioned most of the flaws with keyword difficulty in the quote above, even going into detail on how Ahrefs and Semrush calculate the metric differently.
I’ll give you a few more reasons I don’t like it, but here’s my main contention: it has low to no predictive validity.
I only saw one study correlating keyword difficulty scores with performance, but the misuse of statistics was quite egregious, barely worth mentioning. For the nerds, see Anscombe’s quartet or why correlation doesn’t always mean correlation.
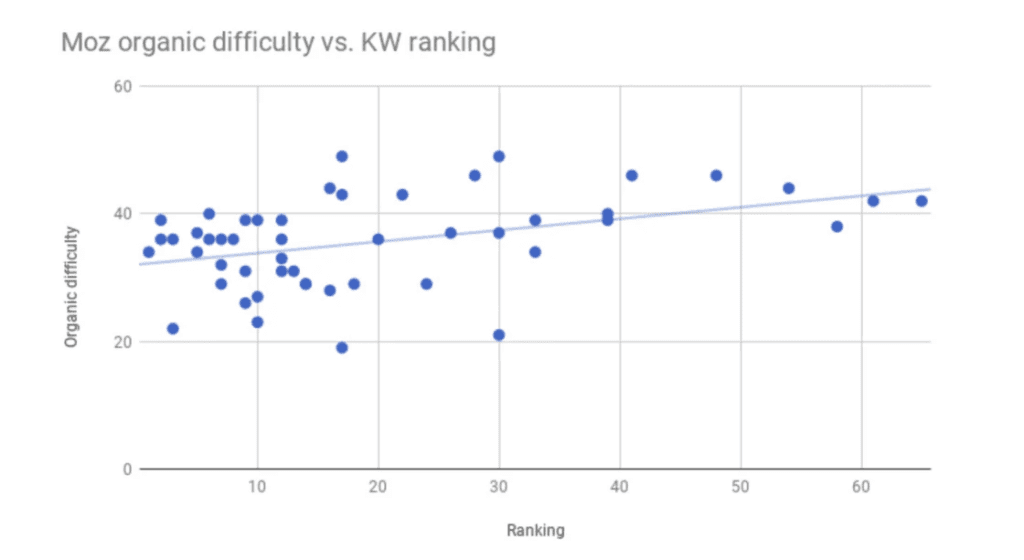
I would not call this strongly predictive
What is Keyword Difficulty?
It’s a number used to approximate how hard it is to rank for a given keyword. The higher the number, the more difficult it is to rank your page (usually on a scale of 1-100).
All tools calculate this their own way. Ahrefs’ score “is based on the number of referring domains (RDs) the Top 10 ranking pages (organic search results only) for a given keyword have.”
Semrush uses a more complex formula, a confluence of weighted variables like median number of referring domains, median authority score, search volume, ratio of do-follow / no-follow links, presents of featured snippets, etc.
They’ve also introduced a personalized keyword difficulty score that takes your domain into account when scoring opportunities.
While I think the additional variables and weighting system is a major improvement on the simplistic use of referring domains, there are still many factors it doesn’t account for and cannot predict, some of which I’ll cover below.
First, Where Keyword Difficulty Can Be Useful
Let’s start with a note of positivity, a little compromise if you will.
Keyword Difficulty can be useful as a first pass filter when dealing with large quantities of keywords to sift through.
For example, if you’re working on a newer website, you can probably safely filter out most 80+ KD keywords.
More interesting to me is using keyword difficulty as the first pass on additional research.
Laura Gray, Organic Growth Strategist at Omniscient, told me she uses KD as such:
“It’s sometimes more of a litmus test. You often find that a difficult keyword coincides with a broader term (and usually much higher volume) or a term that is dominated by websites with a strong online presence and domain ratings. If you find your keyword is a high difficulty, is it actually targeted enough?
An example here is
I had to obfuscate some of the details here, of course, but you get the picture.
Now, the problems with keyword difficulty…
KD doesn’t equate to “cost”
The reason keyword difficulty is useful at all is because it introduces a negative variable in prioritization formulas.
Volume or impact attempts to quantify the upside. Keyword difficulty, theoretically, should counter that with how hard, expensive, probable, or time consuming it will be to achieve that upside.
But keyword difficulty, as implemented by popular tools, doesn’t actually do that.
Here’s a very easy thought experiment.
Imagine HubSpot, a company with a domain rating of like 1000, has two potential keyword targets with the associated metrics:
- Keyword A; MSV 1000; KD 75
- Keyword B; MSV 1000; KD 75

The numbers make them look identical, but they’re not. Because a quick SERP analysis shows that, while both SERPs are dominated by high authority sites, there are quite a few meaningful discrepancies in the content itself.
The SERP for keyword A is made up of pages with shallow content, and in fact, it seems like the pages ranking are mixed in format, meaning there may be some search intent gap that has yet to be exploited.
The SERP for keyword B is filled with similar titles: “The Ultimate Guide to Keyword B.” The average word count is 5,000, and each page has interactive elements, infographics and charts, and design.
Clearly, using common sense, it would be easier and less costly to produce a piece of content targeting Keyword A, no?
Topic authority and comparative advantage
Probably, topical authority matters.
You can never be too sure about this stuff. But probably, if your site is completely devoted to SaaS onboarding, and you find a keyword related to SaaS onboarding, but the only ones that rank are HubSpot, Zapier, and the rest of the usual players, then you can probably beat them easier there than you could for a keyword like “inbound marketing” or “SaaS automation,” even if they had equal keyword difficulty scores.
Of course this stuff can’t go into keyword difficulty formulas, because it is not easily measurable. Just because something is easily measurable, doesn’t mean it is impactful. And sometimes that which is hard to measure is quite meaningful.
Search intent gaps
Sometimes you have a fractured SERP with a bunch of huge players ranking but with very different content formats.
We work with a lot of data-related products, and I see it all the time – a “high difficulty” keyword with IBM, Snowflake, Salesforce, etc. hogging up the SERPs.
Then you look through, and you’re like, “wait, the dust hasn’t settled here. The content itself is bad, scattershot, and lacks cohesion.” Some pages are documentation, some tool lists, some landing pages, and some forums. Then you realize, “I can easily rank for this, keyword difficulty be damned.”
A little common sense goes a long way!
What about the content?!
The assumption buried beneath the 1-100 keyword difficulty score is that on-page SEO doesn’t matter.
Well, to be fair, Ahrefs explicitly mentions this and states clearly, “we do not recommend you base all your SEO decisions on our KD score alone.”
And while this is increasingly rare because of the increased competition and general upleveling of content marketing and SEO, there are some SERPs where the quality of existing content is….bad. And you could write it better. And you could, theoretically, outrank competitors with higher website authority or more referring domains without exerting that much effort.
Right, so what do you do, Alex?
Very simply, when I’m building out a strategy, I use a single, somewhat subjective score: ease.
I score ease on a scale of 1-10 (just like I do with impact, business relevance, and conversion intent). I take into account the cost / effort involved in creating the content, the SERP competition (domain level and page level), and the on-page SEO competition.
It’s a rough shot, and I do use keyword difficulty to approximate the SERP competition. But then I apply my own experiential lens to make sure I’m including the other variables.
For content optimization projects, I’m more rigorous. First, I apply a filter for topical relevance, knowing that these will likely be a lower effort to optimize (and can benefit from tactics like internal linking, etc).
Then, I use a composite difficulty score based on page level links, domain level competition, and most important, on-page content scores. I use a custom model, but you can get this score with a tool like Content Harmony:

Avoiding Middlebrow Science
I believe it’s better not to use data at all than to use it inappropriately.
Here’s the logic: data can give you additional confidence in decision making, and if you’re using it poorly, it can make you both wrong and confident (not a fun combination).
As Nassim Taleb put it in Fooled by Randomness, “Beware the middlebrow: A small knowledge of probability can lead to worse results than no knowledge at all.”
So either be truly rigorous with data, or just make faster decisions with a good bit of humble subjectivity.
David and I discussed analytics on a (yet to be released) podcast.
An idea we turned to was the idea of “precision versus utility” tradeoffs.
Basically, data is useful in reducing uncertainty in decision making, and you’ll never completely reduce uncertainty. So there’s a point when increasing the complexity and accuracy of your data (which takes time and money) has diminishing returns and reduces the utility or expected value of the data (it doesn’t greatly improve clarity or decision making).
We used the example of seasonality – regular fluctuations in time series datasets that occur over time cycles (monthly, weekly, yearly etc) that can obscure signals in your data.
There’s a technical method with which you can analyze seasonality, called time series decomposition.
There’s also a non-technical method by which you can ascribe seasonality, most often called common sense. If your traffic dropped during the Super Bowl, you can probably just say “this happened because of the super bowl” without writing a single line of Python.
Anyway, what we came to was the idea that if you’re going to be precise and analytical, do it entirely. Do science, not scientism.
We all love numbers, especially simple ones, to help us add some “objectivity” to what we’re doing, to complete the story of our performance. That’s why NPS is so popular, despite its numerous limitations and inadequacies.
It’s scary to think that you’re operating in the dark, uncertain if a given investment will pay off. The truth is, that’s the reality of decision making – some inputs are predictive, some luck is involved, and then there’s a bunch of factors we don’t know or can’t measure or build into our model.
You can predict, to some degree, the performance of an ensemble, but as you drill down to individual actions (experiments, content pages, stocks, etc.) your predictive power shrinks precipitously. That is, in fact, why we advocate so strongly for portfolio thinking, particularly the barbell strategy, which makes risk and reward explicit.
I mean, returning to keyword difficulty, and even knowing nothing about statistics, just look at this chart:

If you remove the trend line and just look at the data points, are you really impressed by the predictive power of this metric? This is supposed to be one of the more accurate tools from the case study. How much signal do you actually see in this chart? Look at all the data points with KD somewhere between 35-40, and then look at how widely they differ in performance.
So, look, if keyword difficulty helps filter and cull your massive keyword research, saving you time, I say go forth. But apply a bit of constraint when using it as an input into prioritization formulas. It’s extremely limited and has very little predictive power.
Want more insights like this? Subscribe to our Field Notes.
