“Half my advertising spend is wasted; the trouble is, I don’t know which half.” – John Wanamaker
When someone asks you how your content marketing is performing, do you know how to answer them?
Content marketing ROI, like all forms of measurement, are essentially flawed. You’ll never be able to measure every little interaction, upside, or even cost (when you include opportunity costs and counterfactuals).
Even if you wanted to measure something fairly straightforward and quantitative, like lead generation, there are a variety of challenges in the current tooling and models available.
However, that’s not an argument against measurement. Measurement is absolutely critical.
Why is Content Measurement Important?
Measuring content serves three main purposes:
- It lets you use performance tracking to keep an eye on your progress over time and see how well your efforts are paying off.
- It provides valuable insights that you can use to make your content even better.
- It’s a communication tool you can use to showcase your value and get continued buy-in and investment (critical for future growth).
Without measurement, it’s impossible to know if your content is having the desired effect. When you put a dollar into your marketing efforts, how many dollars are getting out of them?
This is just business 101 stuff.
Sure, you can’t measure everything. That’s fine. You can’t measure everything with paid ads either, but that doesn’t stop your demand generation counterparts from tracking how much they’re spending and what their return on ad spend (ROAS) is.
Of course, this helps you narrow your focus and choose which goals matter, too. What are your marketing goals? Is it to drive more pageviews or social shares, or is it revenue? What leading indicators are predictive of revenue? Asking these questions helps you focus on fewer things that lead you in the right direction.
Once you’ve got your KPIs in place, you can add content optimization to your portfolio of value additive tasks. Say you wrote a beautiful piece of content but it’s ranking page two.
Now you can diagnose the problems preventing it from ranking (on-page SEO, technical SEO, backlinks), and actually hatch a plan to improve the piece.
Finally, and not to be underrated: measurement is a communication tool.
Of course YOU understand the value of content. You want to launch more creativity and risky projects. You want to double your output and headcount.
But your boss and boss’s boss are looking at the business growth model to see where growth is coming from and where it’s likely to come from with future investment. If you’re not able to do some basic attribution to show that content marketing is generating meaningful ROI, why would your boss shift budget from a revenue generating activity towards one that “can’t be measured?”
Again, you’ll never be able to measure all the benefits of content marketing. But that’s fine.
Measure what you can, and accept any additional upside as a bonus.
4 Layers of Content Measurement
Content strategy can have several goals, and sometimes they’re even in conflict with each other.
Some programs are aimed at increasing brand awareness overall. Some are aimed at lead generation. Some are aimed at sales enablement, customer marketing, or retention.
Thus, there are several content marketing metrics that could matter to your business.
Additionally, there are leading indicators and lagging indicators. Some metrics measure the content itself, and some metrics measure the audience’s interaction with the content.
I’ll break down these measurement protocols into 4 different layers, and you can choose which metrics are most important to your content strategy:
- Content Input Metrics
- User Engagement Metrics
- Content Distribution Metrics
- Content Conversion Metrics
1. Content Input Metrics
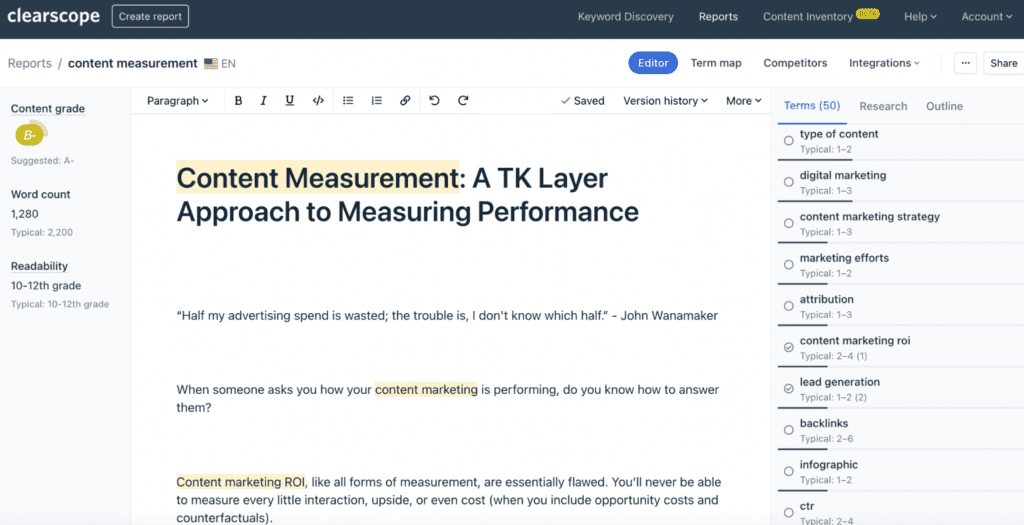
These metrics involve measuring the effectiveness of the content itself. Here are some examples:
- Word count
- Clearscope or Surfer score
- Cost per blog post
- Images per post
- Expert quotes per post
- Publication velocity
- Link velocity
- Product relevance scores
- Average search volume per search query
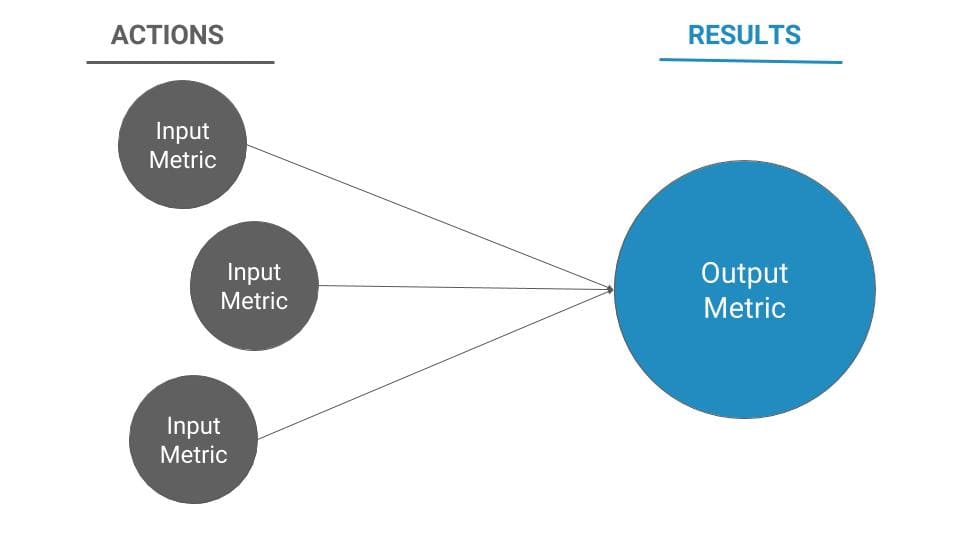
These metrics are quality indicators. They don’t necessarily measure performance, but they measure the inputs you can control that tend to predict the performance of a piece.
When I worked in experimentation, a common metric to optimize was conversion rate. You can increase conversion rates many ways, but there’s always some level of uncertainty with regards to any given experiment.
Thus, it was important to track “input metrics” as well – things like experiment velocity (how many experiments launched per month), experiment win rates (of the experiments we launch, how many win), and size of uplift (of the experiments that win, what was the average uplift).
By moving the needle on these metrics, we didn’t even need to focus on the outcomes; like Bill Walsh says, “the score keeps track of itself.”
How you set up your quality indicators will depend on your own standards and definition of what makes “good content.”
For me, there’s definitely an element of velocity at play. To rank in search, you’ve gotta write a lot of content.
There’s also differentiation through expertise. I do this by including expert quotes from an influencer in each piece if possible. This doubles as a distribution strategy, because the influencer will usually share the piece to their audience.
Work backward from your core KPIs and see if you can find artifacts of the content ITSELF that predict success.
2. User Engagement Metrics
I recently asked on Twitter, “what does it mean when content is engaging?”
Lots of different answers, but they primarily converged on this: engaging content means the reader took a visible action from the content.
That’s a little broad, I have to say.
The truth is, engagement is in the eye of the beholder. That’s how Bryan Eisenberg put it, anyway:
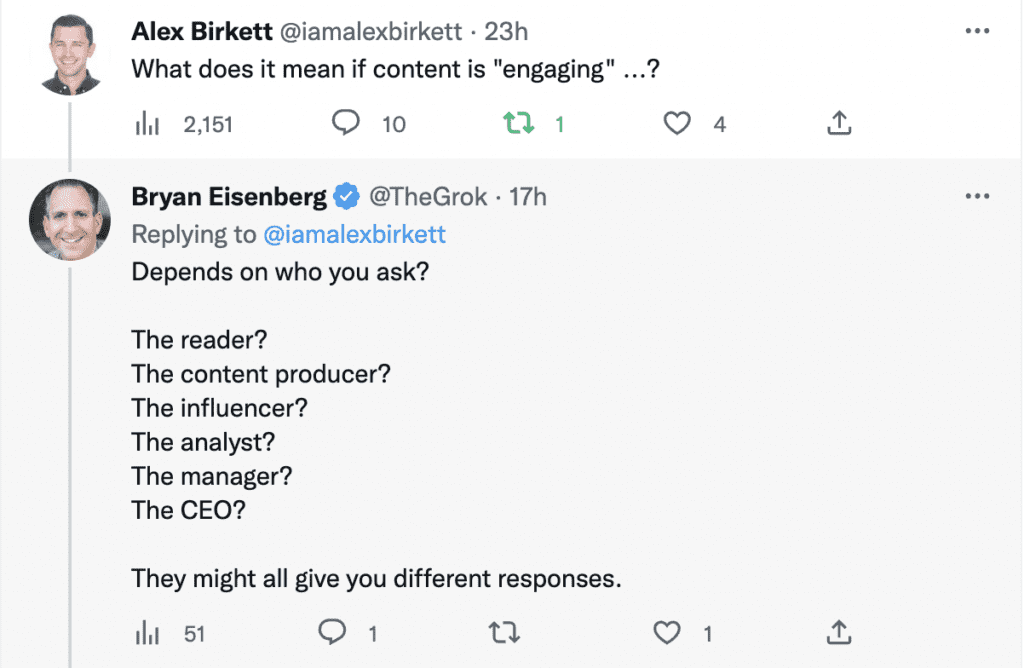
User engagement signals are clearly important, but it’s necessary to ask “why” and “which user engagement signals are important?”
These, again, should map towards your macro-KPIs that correspond to revenue. Otherwise, who gives a f*ck what your bounce rate is?
There are a number of different user engagement metrics you can track, but some of the most common ones include:
- Average time on page
- Pages per session (especially to related content)
- Bounce rate
- Scroll depth
All of these metrics give you insights into how engaged users are with your content. For example, if you see that users are spending a lot of time on your page, that’s a good sign that they’re finding your content valuable.
However, approach these metrics with skepticism and clarity. Is a high bounce rate bad? Or does it mean the user got their answer and left to put it into action? Or maybe they read the piece, didn’t take any action, but shared it in Slack with their colleagues?
Does every piece of content need to drive a conversion? Maybe. But maybe not. A different type of content should have different goals.
Does someone spending more time on the page mean they found the content…engaging? Or does it mean that your writing style was so convoluted that they couldn’t find the answer to their query?
All I’m saying is be careful with these metrics, as it’s easy to make up narratives with them. Additionally, things like bounce rate benchmarks are as good as useless. The trouble is, analytics tools measure these things with greater ease than they do important revenue metrics.
Done correctly, these metrics should help you measure the user experience / user behavior associated with your content. They should map towards your business goals.
Two slept-on engagement metrics:
- Return visitors
- Comments
You can even track comments on social media platforms – by and large, Twitter is the comment section of the internet nowadays, not your blog.
Return visitors are such a great metric. It’s hard to game and, regardless of your stupid bounce rate or time on page, means you’re resonating and distributing your content appropriately.
3. Content Distribution Metrics
Content distribution is clearly one of the most important levers you have in your content marketing strategy.
Content creation means nothing if people don’t actually see or read your content.
There are generally two forms of content distribution:
- Short term
- Long term
Short term channels include social media marketing, email blasts and cold outreach, forum and community engagement, paid acquisition, and other short term spikes.
Long term promotion channels are almost always email list building or search engine optimization (SEO).
I like to include both in my approach to content promotion.
For short term metrics, you want to look at shareability. Shareability metrics go hand-in-hand with user engagement metrics because they give you insights into how viral your content is.
The more shareable your content is, the more likely it is to reach new audiences and generate traffic (and backlinks) back to your site. And as we all know, (relevant) traffic = money.
Some of the most important shareability metrics include:
- Shares
- Likes
- Retweets
- Pageviews from social networks
- Organic pageviews
- Comments
- Referral traffic
These metrics gives you a good idea of how popular your content is and how much engagement it’s generating on social media sites like Facebook and Twitter.
If you see that a particular piece of content is getting a lot of shares and likes, that’s an indication that it’s resonating with users and has potential to reach new audiences.
Similarly, if you see that a piece of content is generating a lot of comments, that’s an indication that users are engaged and interested in what you have to say.
Bottom line: shareability=good; but no shareability != bad.
Not all content needs to be “shareable,” especially the type of content designed to rank in search and generate conversions. A landing page won’t be as shareable as an infographic for example.
Now, long term promotion metrics mainly fall into the search category. These should be leading indicators towards ROI, things like:
- Keyword rankings
- Organic pageviews
- Click-through rate (CTR)
These things are easy to track in Google Search Console or Ahrefs. We always set up dashboards for these in Google Data Studio.
For your email list, you just want to be tracking email list signups, MQLs, leads (however you define them). These do tend to fall more into the “conversion metrics” bucket, though.
4. Content Conversion Metrics
Conversion metrics are probably the most important metric for measuring content performance because they give you direct insight into how successful your content is at converting visitors into customers.
Some of the most important conversion metrics include:
- Conversion rate
- Lead generated per blog post
- Revenue per blog post
Some of these metrics can be set up in Google Analytics. For instance, measuring conversion rate is easy if you’re using Google Analytics. You just have to go to the “Conversions” tab and click on “Goals.” Here you’ll be able to see how many visitors are taking the desired action (e.g., signing up for your email list, making a purchase, downloading a PDF, etc.).
Leads Generated Per Blog Post is slightly more confusing for most people, because you have to choose an attribution window. The easiest way to do this is on a last click basis.
You can just go to Site Content > Landing Pages and then choose your lead metric of choice. This will give you the number of leads per blog post as well as the conversion rate per blog post:
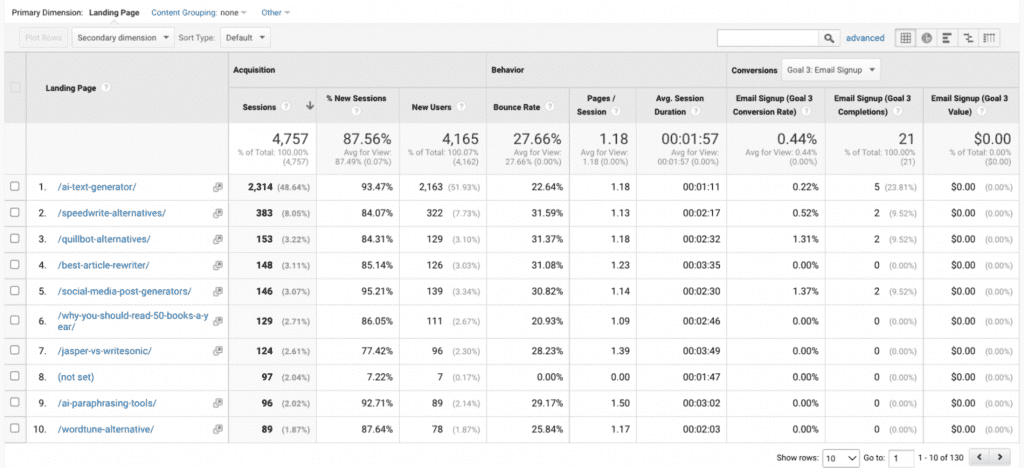
How you define a “lead” could differ depending on your business, too; sometimes it’s a product signup, sometimes it’s downloading a content asset.
Now, revenue from content is the trickiest. For B2B SEO, you’ll usually have to connect your web page analytics to your CRM software or marketing automation software to get downstream metrics, since people don’t usually just buy right from the site (rather, they get a demo or something).
How to do that is outside the scope of the article, but it’s highly recommended. Connecting your efforts to revenue is the best way to prove the case that your work is valuable and worth investing in.
Conclusion
In order for content marketing to be truly successful, it needs to be measured using key performance indicators (KPIs).
By tracking KPIs such as user engagement, shareability, and unique visitors, publishers and brands can get valuable insights into what’s working well and what needs improvement in their content strategy.
Even if you can’t measure every benefit of content, you should still measure what you can It could mean the difference between success and failure; between increased headcount and investment, or a stagnating program that is looked at as a cost center.